Course Overview
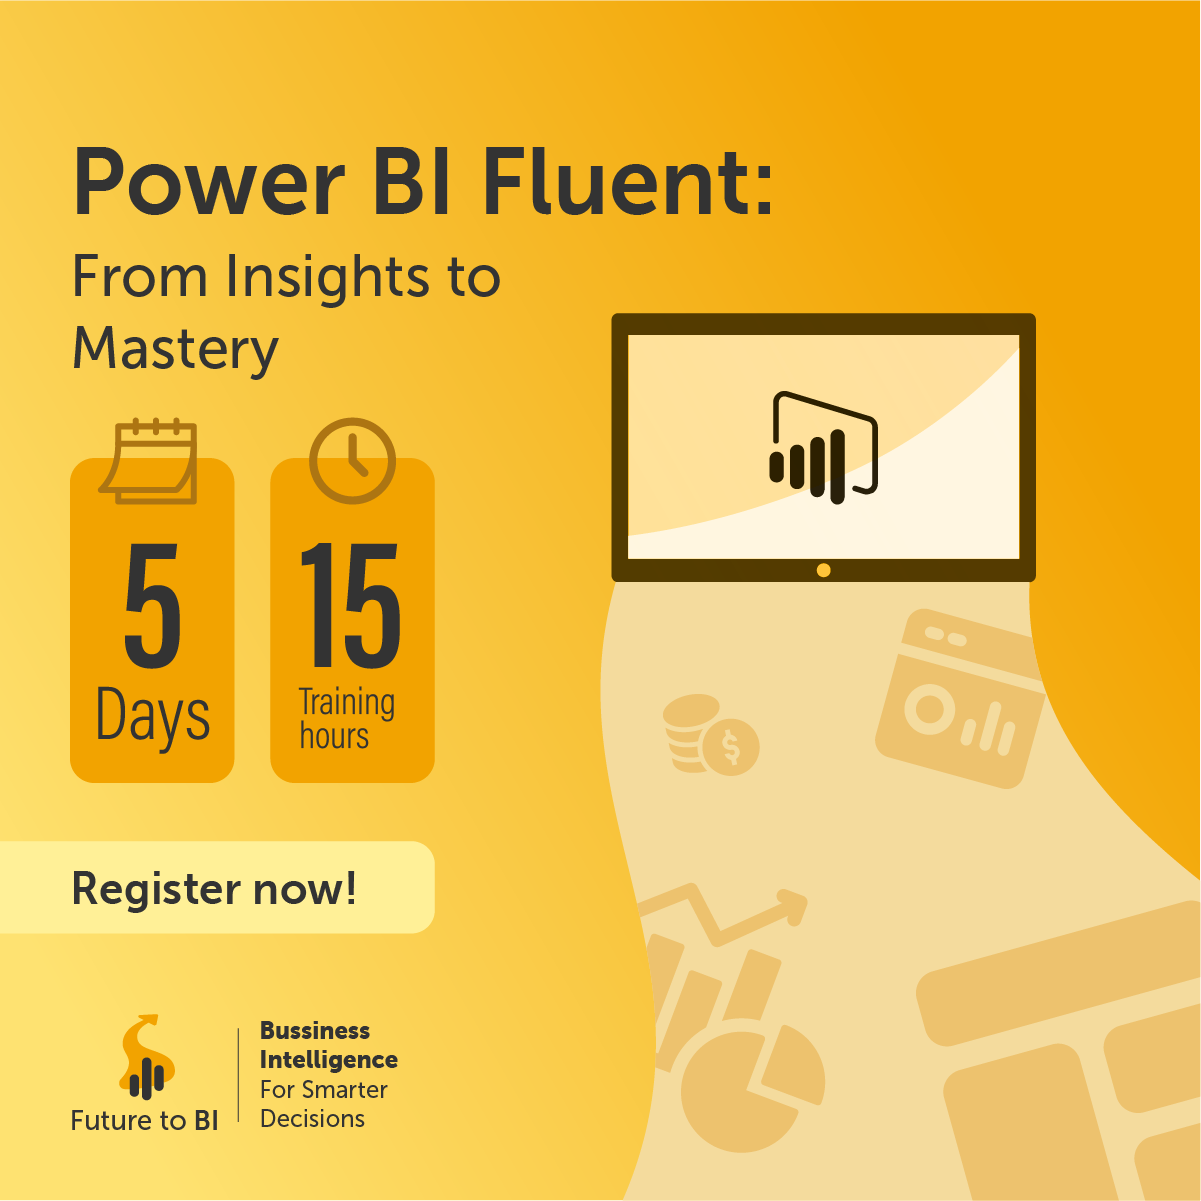
This course guides participants through the complete Power BI lifecycle, enhanced with AI tools such as ChatGPT and Claude. Participants learn to design interactive dashboards, create automated reports, and apply analytical thinking to solve real-world business challenges.
Learning Objectives
- Transform raw data into meaningful insights using Power BI tools and techniques
- Build interactive dashboards tailored to specific audiences
- Leverage automation, advanced visuals, and data modeling for efficiency
- Apply analytical thinking and DAX to perform deeper analysis
- Use ChatGPT and Claude to support Power Query, DAX, modeling, and documentation
Target Audience
Team Members
Professionals seeking to elevate their data analysis capabilities
Business Analysts
Business users and analysts interested in creating compelling dashboards
Decision Makers
Decision-makers aiming to leverage data for strategic decisions
Beginner to Intermediate Users
Users looking to enhance their Power BI proficiency (From Zero to Hero)
Course Curriculum
- Understanding business intelligence and the Power BI ecosystem
- Identifying business requirements and dashboard audiences
- Understanding the complete Power BI workflow
- Connecting Power BI to common data sources
- Introducing ChatGPT and Claude as supporting analytics tools
- Connecting to Excel, CSV, folders, databases, and online sources
- Cleaning data, changing data types, and handling missing values
- Splitting, merging, appending, pivoting, and unpivoting data
- Creating conditional and custom columns
- Using ChatGPT and Claude to explain or troubleshoot Power Query steps
- Reviewing and validating AI-generated M code
- Understanding fact and dimension tables
- Building star-schema data models
- Creating and managing relationships
- Understanding cardinality and filter direction
- Creating date tables and hierarchies
- Improving model structure and performance
- Using AI to review model design and document tables and relationships
- Understanding measures and calculated columns
- Creating aggregation, logical, date, and time-intelligence measures
- Understanding filter context and calculation context
- Building KPIs and performance indicators
- Using ChatGPT and Claude to explain, generate, and troubleshoot DAX
- Testing AI-generated measures against business requirements
- Selecting the right visual for each business question
- Working with charts, cards, matrices, maps, and slicers
- Applying themes and professional formatting
- Creating drill-down, drill-through, bookmarks, and tooltips
- Designing dashboards for managers and decision-makers
- Using AI to suggest visual choices, titles, and dashboard layouts
- Using Key Influencers and the Decomposition Tree
- Applying forecasting and anomaly detection
- Creating dynamic narratives
- Using What-If parameters
- Applying analytical thinking to discover trends and performance drivers
- Using ChatGPT and Claude to suggest additional analytical questions
- Publishing reports to Power BI Service
- Creating workspaces, apps, and dashboards
- Configuring scheduled refresh
- Sharing reports securely and applying Row-Level Security
- Understanding gateways and collaboration options
- Using AI to create report documentation and user instructions
- Preparing data using Power Query
- Building a structured data model
- Creating DAX measures and KPIs
- Designing an interactive Power BI dashboard
- Publishing and presenting the report
- Using ChatGPT or Claude to support selected development tasks
- Validating all AI-generated calculations and findings
- Producing an executive summary based on the Power BI results
 CPD Accredited